
Real Estate Loan Performance Insights – March 2024
Real Estate CoreLogic March 31, 2024

Real Estate CoreLogic March 31, 2024
The CoreLogic Loan Performance Insights report features an interactive view of our mortgage performance analysis through January 2024.
Measuring early-stage delinquency rates is important for analyzing the health of the mortgage market. To more comprehensively monitor mortgage performance, CoreLogic examines all stages of delinquency and transition rates, which indicate the percent of mortgages moving from one stage of delinquency to the next.
The report is published monthly and covers the national, state, and Core Based Statistical Area (CBSA)/Metro level. It includes transition rates between states of delinquency and separate breakouts for 120+ day delinquency.
“Nationwide, the overall mortgage delinquency rate held steady in January, and the serious delinquency rate fell from a year ago. However, one-third of metros posted an increase in the overall delinquency rate from one year earlier, and a handful reported an increase in serious delinquency rates. While the sizable delinquency rate uptick in the Kahului-Wailuku-Lahaina, Hawaii metro is a result of last year’s wildfire, increases in other areas of the country could be a sign that borrowers are experiencing budget strains.”
– Molly Boesel
Principal Economist for CoreLogic
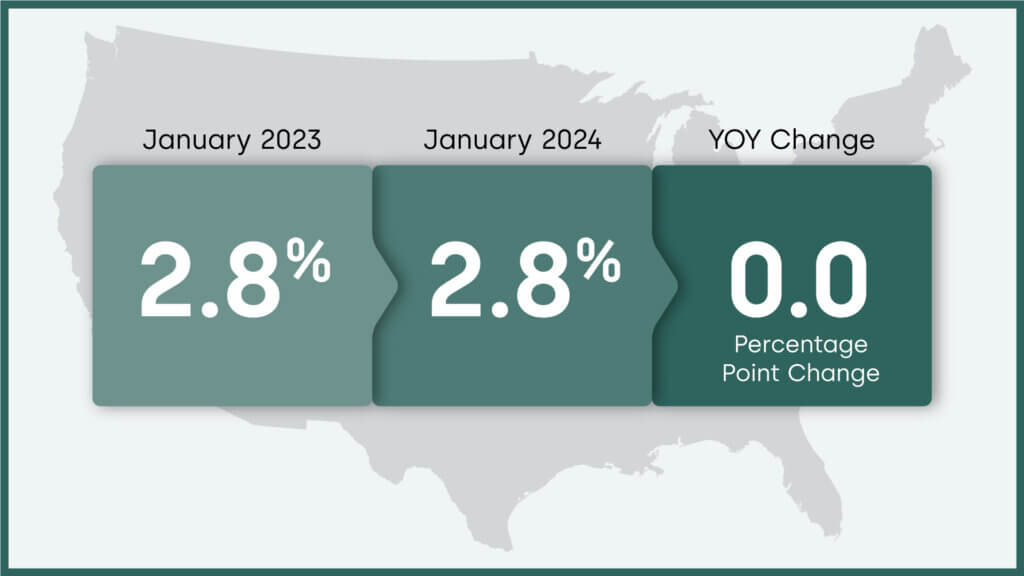
In January 2024, 2.8% of mortgages were delinquent by at least 30 days or more, including those in foreclosure. This represents a 0.0 percentage point change in the overall delinquency rate compared with January 2023.
As was the case for most of 2023, U.S. mortgage delinquency and foreclosure rates remained near an all-time low in January. A thriving job market is helping many homeowners pay their mortgages on time, with the U.S. Bureau Of Labor Statistics putting the national unemployment rate at less than 4% for the past two years. Still, a dozen states and a substantial number of metro areas posted year-over-year increases in overall delinquency rates, indicating that the current employment situation does not benefit all Americans equally.
CoreLogic examines all stages of delinquency to more comprehensively monitor mortgage performance.
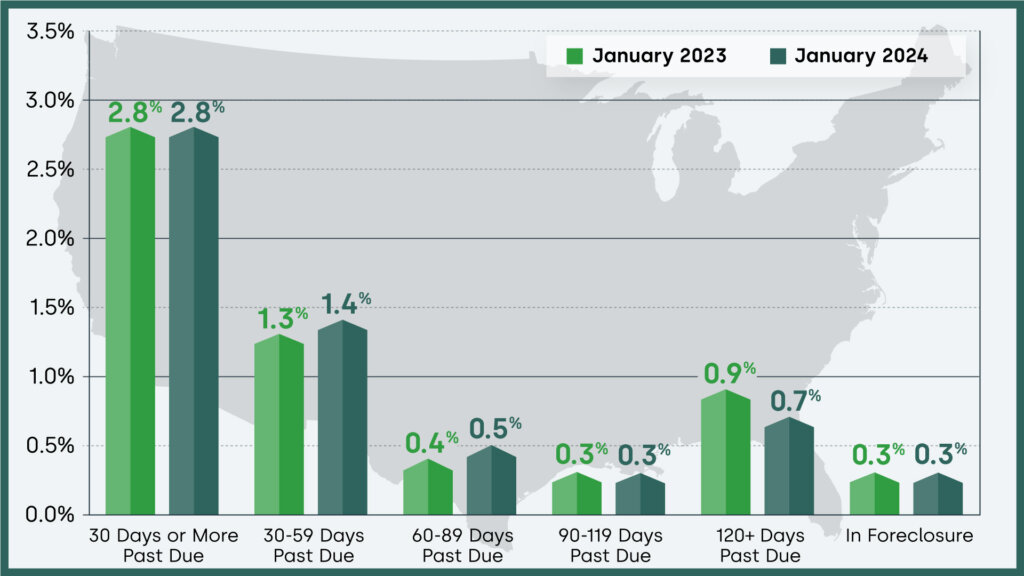
The nation’s overall delinquency rate for January was 2.8%. The rate for early-stage delinquencies – defined as 30 to 59 days past due – was 1.4% in January 2024, up from January 2023. The share of mortgages 60 to 89 days past due was 0.5%, up from January 2023. The serious delinquency rate – defined as 90 days or more past due, including loans in foreclosure – was 1%, down from 1.2% in January 2023.
As of January 2024, the foreclosure inventory rate was 0.3%, unchanged from January 2023.
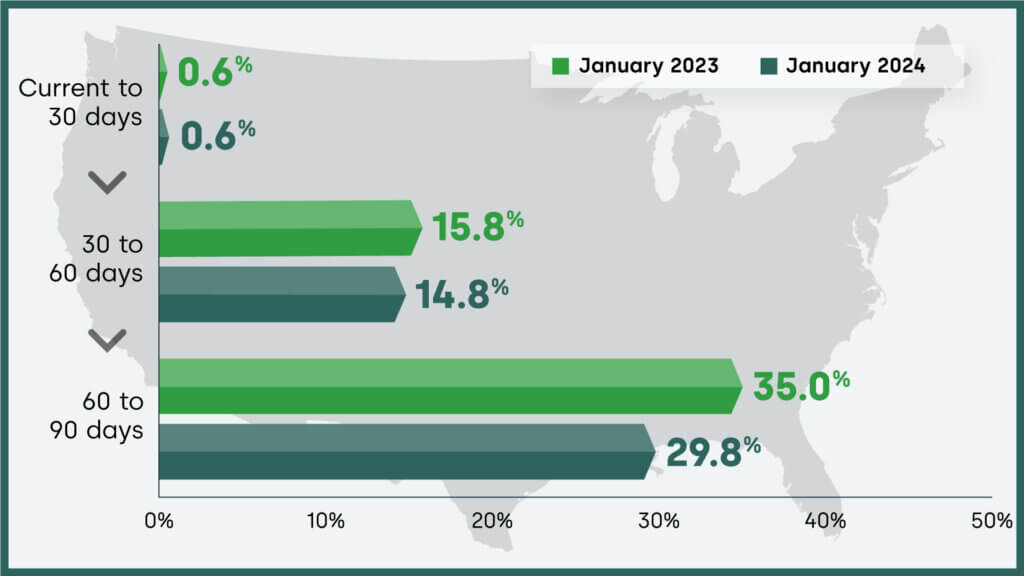
CoreLogic examines all stages of delinquency as well as transition rates that indicate the percentage of mortgages moving from one stage of delinquency to the next.
The share of mortgages that transitioned from current to 30 days past due was 0.6%, unchanged from January 2023.
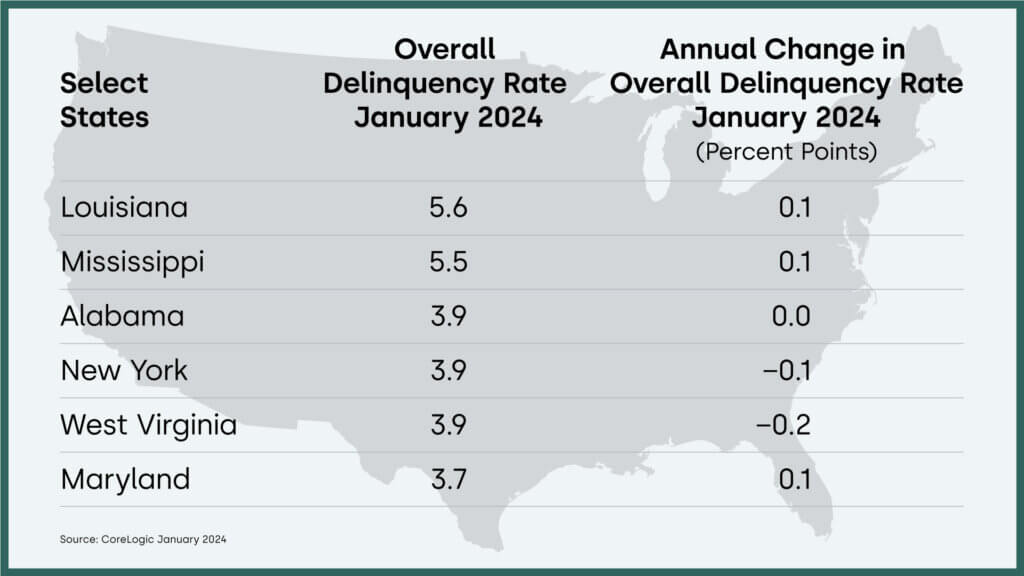
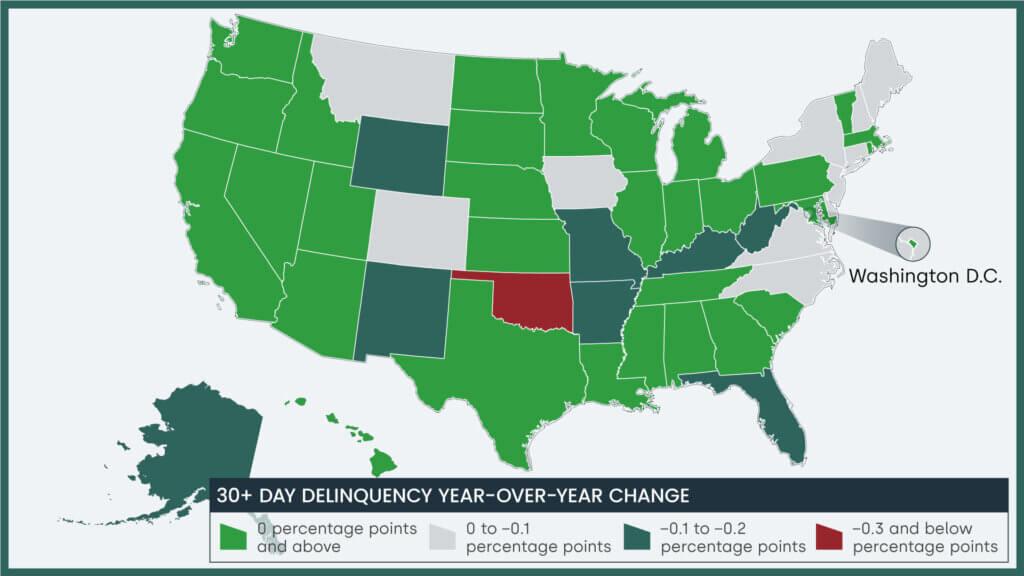
In January 2024, 12 states posted year-over-year increases in overall delinquency rates, while 19 states were unchanged. Oklahoma posted the largest annual decline at -0.3%.
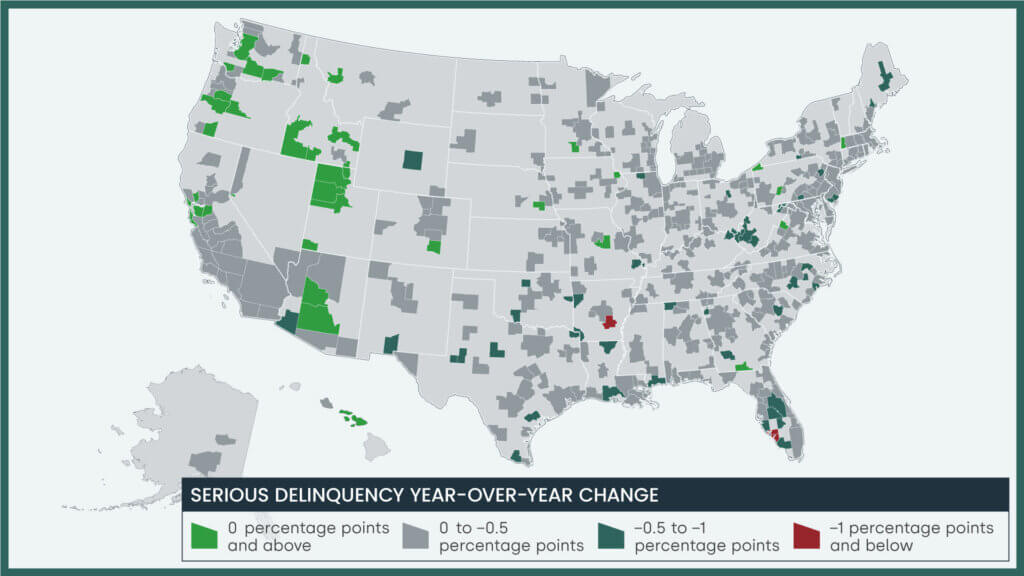
Serious delinquency is defined as 90 days or more past due, including loans in foreclosure.
There were four metropolitan areas where the Serious Delinquency Rate increased.
There were 32 metropolitan areas where the Serious Delinquency Rate stayed the same.
There were 348 metropolitan areas where the Serious Delinquency Rate decreased.
Measuring early-stage delinquency rates is important for analyzing the health of the mortgage market. To more comprehensively monitor mortgage performance, CoreLogic examines all stages of delinquency as well as transition rates that indicate the percent of mortgages moving from one stage of delinquency to the next.
For ongoing housing trends and data, visit the CoreLogic Intelligence Blog: www.corelogic.com/insights.
The data in this report represents foreclosure and delinquency activity reported through January 2024. It accounts for only first liens against a property and does not include secondary liens. The delinquency, transition, and foreclosure rates are measured only against homes that have an outstanding mortgage. Homes without mortgage liens are not subject to foreclosure and are, therefore, excluded from the analysis. Approximately one-third of homes nationally are owned outright and do not have a mortgage. CoreLogic has approximately 75% coverage of U.S. foreclosure data.
Stay up to date on the latest real estate trends.

First Time Home Buyer

Real Estate

State laws and mandates spur housing production

Home Ownership

Home Owners

Luxury Living

1031 Exchange

Marin County Homes

Luxury Homes